How to use Core Web Vitals & Google Pagespeed Insights
12 min readGoogle Pagespeed Insights (PSI)
Pagespeed Insights is a tool created by Google to test, measure and report useful metrics about the (technical) performance of web pages. It gives a lot of information but the most noticeable one, and usually the one to brag about, is the PSI Score.
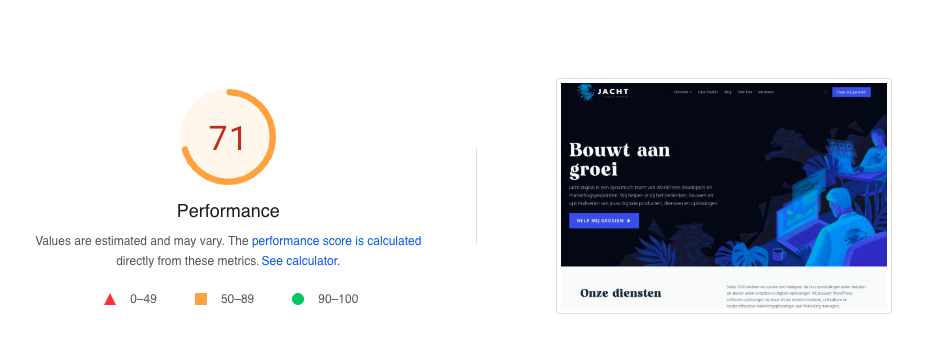
Although it doesn’t say much, a “perfect” score always looks good and a high score (90+) does mean you’re doing something right. At least from a technical point of view, because it can’t check if your content makes sense or content is readable in any way.
So even though a good score helps with SEO, because it means your website has a good performance which is good for visitors, it’s only a very small fraction of the final search rank which search engines calculate. That said; Google has already said for several years that performance and user experience is becoming a bigger factor in their search ranking, especially for mobile. And because of this having a website which is (also) performant on mobile devices is probably more important.
Core Web Vitals
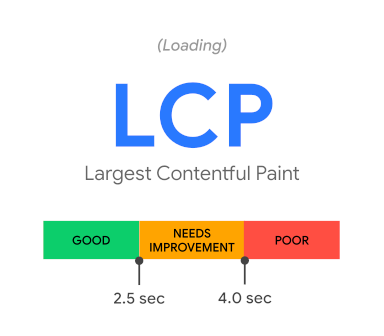
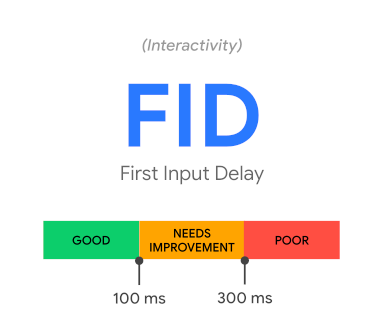
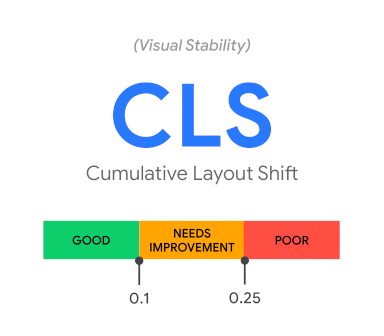
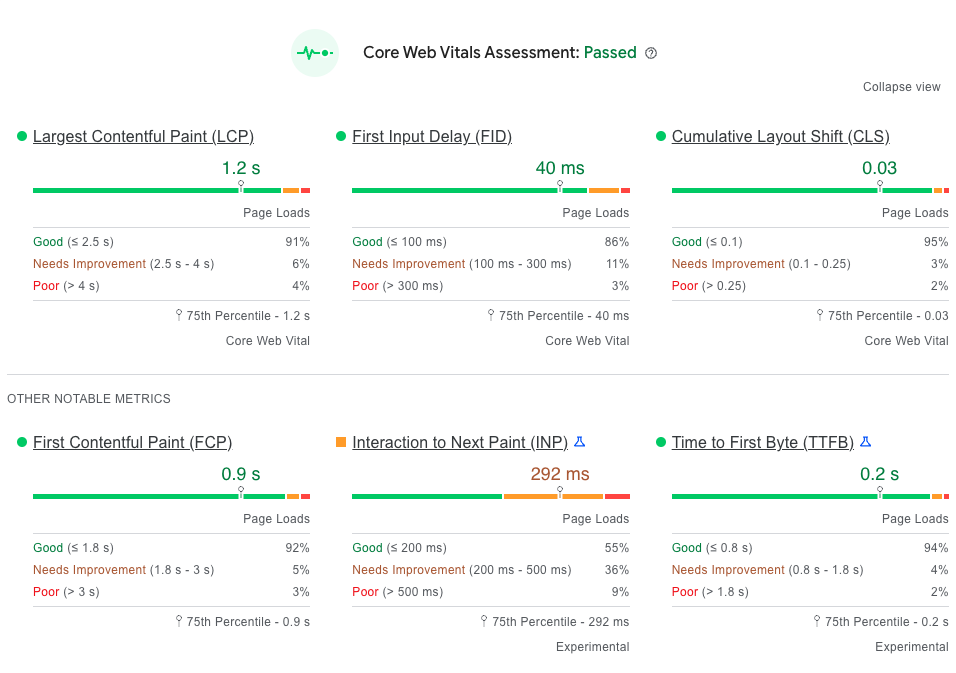
For a couple of years Google has put the focus on 3 specific metrics called the Core Web Vitals. These metrics are Largest Contentful Paint (LCP), First Input Delay (FID) and Cumulative Layout Shift (CLS). And even with these 3 metrics in the spotlight, the rest is still as important if not more important.
Largest Contentful Paint (LCP)
The LCP measures how long it takes till the largest element in the viewport (visible part) is loaded. Usually this is the hero (with image or video background). It does not measure the time for this single element, but the time till the element has been fully loaded. So all scripts and styles in the head will also count towards this, and of course images and external assets which are used above the fold. In short; it measures the time till the page is loaded within the screen.
First Input Delay (FID)
FID is a time metric which measures the time it takes for an event to react. For example it takes the time between a user clicking on a button and the moment the browser is executing the action attached to the button. Normally a browser will do this directly (within 10ms), but if a browser is still working on stuff in the background like loading assets or running scripts, this can slow down a lot.
Cumulative Layout Shift (CLS)
CLS is not something you can easily measure, and is not time based but a score. It checks for elements which move around, or cause movement of elements. For example when you load an image, which obviously can take some time, the content below it will change its position the moment the image is loaded. Or when you use javascript to position content after the page has been loaded. These movements will give a higher, and thus worse, score on the CLS. This score is calculated by the impact (how much does it disturb the layout) and the distance (how many pixels does it move).
Other metrics
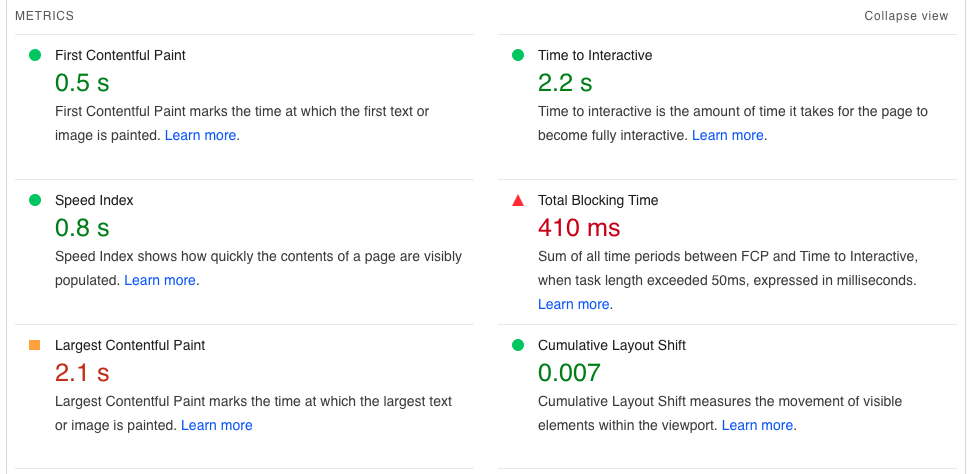
Besides these 3, which together make the Core Web Vitals, there are several other metrics which are measured by PageSpeed Insights and are just as important to look into when optimizing your website or page.
- First Contentful Paint (FCP)
- Measures the time till the first piece of content (like text or image) is rendered on the page. So the first time "any" content is visible in the browser.
- Speed Index
- Measures the time it takes to render elements on the page. For example the time it takes to request, download and show an image on page.
- Time to Interactive (TTI)
- Measures the time till the page is fully interactive. This means that the full page is loaded, including images, scripts and styles, and the visitor is able to see and do anything the page is supposed to do (like clicking a button or scrolling the page).
- Total Blocking Time (TBT)
- The aggregated time of long tasks. Any task (like a mouse click) which takes longer than 50ms to respond is a long task. The TBT will take the time above the 50ms, and add all long tasks together. For example if a task takes 70ms the TBT will be increased by 20ms.
Field Data vs Lab Data
On PageSpeed Insights you will see 2 types of data; Field Data (Discover what your real users are experiencing) and Lab Data (Diagnose performance issues). And you might notice that some metrics appear in both but have different values.
Field Data takes the averages from actual visitors on your website from the past 28 days, which has been gathered by Chrome/Chromium users who visited your website. These numbers won’t change directly the moment you make changes to your website and may not be very precise. However it does give a good indication of the average user experience of visitors. Especially when looking at the percentages, which indicated how many visitors had a good, medium or poor experience the past month.
The Lab Data is gathered at this moment and are actual numbers. Even though it’s not 100% accurate since it doesn’t run on an actual browser, and different browsers may behave differently, it still is the best list to keep an eye on when working on improvements. Also keep in mind that the tests are run from a server local to the tester, and not the location of the server. So it’s possible that if 2 people run a test on the same page, but from different locations, the results are different. And even from the same location it’s possible that the score changes a bit since there are a lot of other factors which may affect the speed of your website.
So what is Lighthouse?
When looking around PageSpeed Insights and Core Web Vitals, you might find another name popping up a lot: Lighthouse. Lighthouse is the tool used by Google to gather the measurements and statistics it uses for PSI and CWV. You’ll also be able to find in it Chrome, Opera or any Chromium based browser as part of the DevTools (Press Command+Option+J (Mac) or Control+Shift+J (Windows, Linux, ChromeOS) to jump straight into the Console panel). It’s also available as a browser extension for Chrome, Opera and Firefox, but also as a CLI tool. There’s even a tool which allows you to scan your whole website at once: Unlighthouse. However if you already use tools like SERanking, AHrefs or Semrush then this is already done for you (with more detailed information about the issues).
Low scores and how to fix them
There can be many reasons why the score for your website is not in the green, but luckily does Google also give information about what is causing the issues and where to look for a fix. These could be as simple as adding a width and height to images or lazy loading external files, but can also mean the server needs to be upgraded or improved caching methods need to be implemented.
The metrics are primarily technical topics which can be solved either at server level (hardware, programming and cache) or are more frontend focused (fonts, large images and javascript).
This might not look like it affects SEO, but it actually does. Google tracks these metrics because it’s how the visitor sees and feels about your website. Nobody likes a slow and unresponsive website, so your ranking will be affected when these numbers are all in the red. You don’t have to worry that a single orange or red number will set you back 10 places in the results, but if your competitors are doing better, they can be listed above you.
To improve these numbers it’s important to understand why they aren’t as good as Google would like, and if it’s something you can and want to improve.
Quick wins
The first step is looking at the ‘opportunities’, which Google believes are quick and easy to fix, and helps with the overall performance of your page/website.
For example providing .webp images instead of .jpg and .png may give a small speed boost since they are generally smaller in size. However, and this is something Google doesn’t tell you, it’s important to set a fallback as well since older browsers may not support these ‘next-gen formats.’
Also deferring scripts (= loading them when possible while not blocking the rest of the page) is a good way to increase the speed of your page loading. But this should be done with care because some scripts must be loaded for the page to function properly. ‘Render-blocking resources’ will be improved by this, just like lazy-loading images and other media.
An important thing to look at are the differences between Desktop and Mobile, because they may give different suggestions, or have a much larger impact on mobile.


As the images show, which are from the same page, desktop and mobile show slightly different possible fixes. Although the one that is almost always shown on live websites is the “Reduce unused Javascript” opportunity. The reason is simple: Google Tag Manager and Google Analytics.
This might sound strange, but the performance drop for using GTM and GA is actually terrible. Not only does it add a lot of additional files to the loading queue, but they’re also loading a lot of code which probably is never used. And lastly, the caching rules on these files are terrible, which again is seen as bad practice by Google. And while adding a lot of tracking and analytics scripts GTM is normal, these only add to an overall bad performance.
So fixing everything isn’t always possible, but knowing what the reason is means you can make a better decision on what you can do and where to focus your attention.
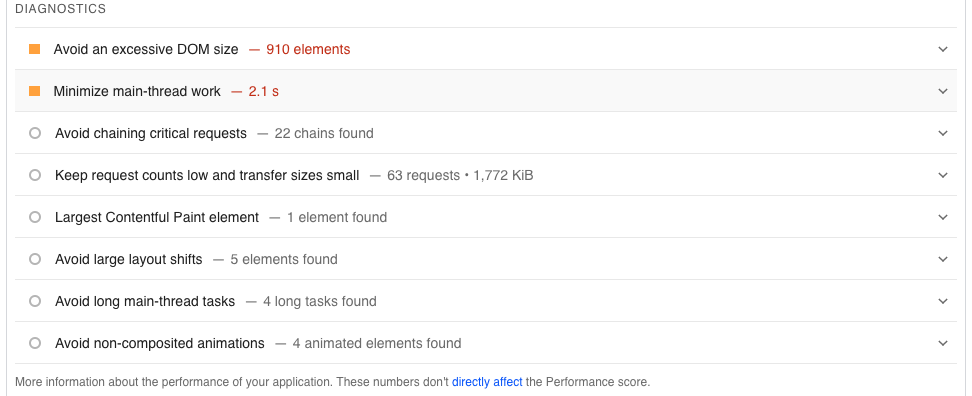
How good is you page The next part of the PSI report is the Diagnostics. These indicate the more technical issues with your website, which can be hard to improve without rewriting code (both front- and backend).
For example “Avoid an excessive DOM size” is seen a lot at WordPress websites which use a theme or page builder, which are known for adding a lot of extra elements to the HTML. Of course these builders are great to quickly build a nice website without any programming knowledge, but the code quality is far from great. It can also mean there are just too many elements on the page created by an excessive amount of content presented which are badly optimized.
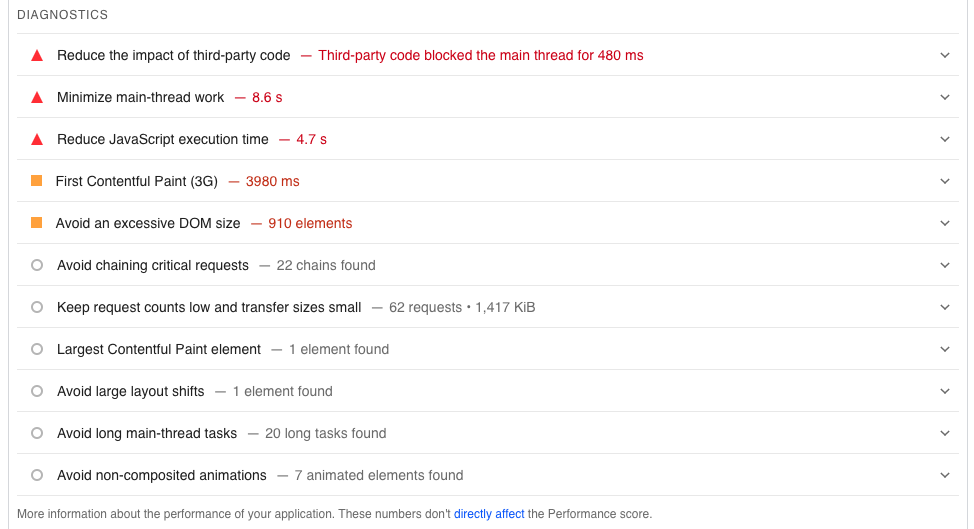
When looking at the mobile version of the same page two of the biggest red flags are “Reduce the impact of third-party” and “Reduce Javascript execution time”. These are usually caused by tracking and analytics scripts from third parties, like Google Tag Manager and the other tools it loads. These are scripts you can’t really control on how they do their job, but it is possible to reduce the impact when loading the page especially when those scripts aren’t needed at that specific page or can be loaded at a later time, by using modified triggers.
The “First Contentful Paint (3G)” is the same as the FCP metric, except it’s measured at a mobile 3G connection, meaning it’s slower than average internet speeds. This results in external files (like javascripts and stylesheets, but also images and fonts) to be loaded slower and will cause the website to show something at a later stage than prefered. One of the major fixes is to use proper caching so files are loaded faster from the server, and have good browser cache rules in place for returning visits. But the test won’t have browser cache, so it will always load all files at every request. There are many ways to optimize the loading speed of files, like minifying scripts and stylesheets, compressing images, swapping fonts and of course lazy loading media files. All these optimization techniques will ensure the FCP is as fast as possible (and many other metrics), but may increase the CLS because things will happen after the page is loaded and layout shifting will happen since elements will suddenly take up more or less space than initially available.
Specific solution for my problem
PageSpeed Insights is testing a lot of different things, and a lot of stuff can be broken or require optimizations. Going through each possible problem and providing a fix for each use-case would probably add another 100 pages of text and code examples, and won’t be enough for all possible scenarios. Most issues which come up through the Core Web Vitals and PageSpeed Insights checks are technical and require a developer or technical solution to be solved. But understanding what the issue is and where to look for an answer is the first step to improvement.
